A sourced dashboard concept brings UK fisheries statistics, Devon and Cornwall port updates and environmental research into a clearer data story.
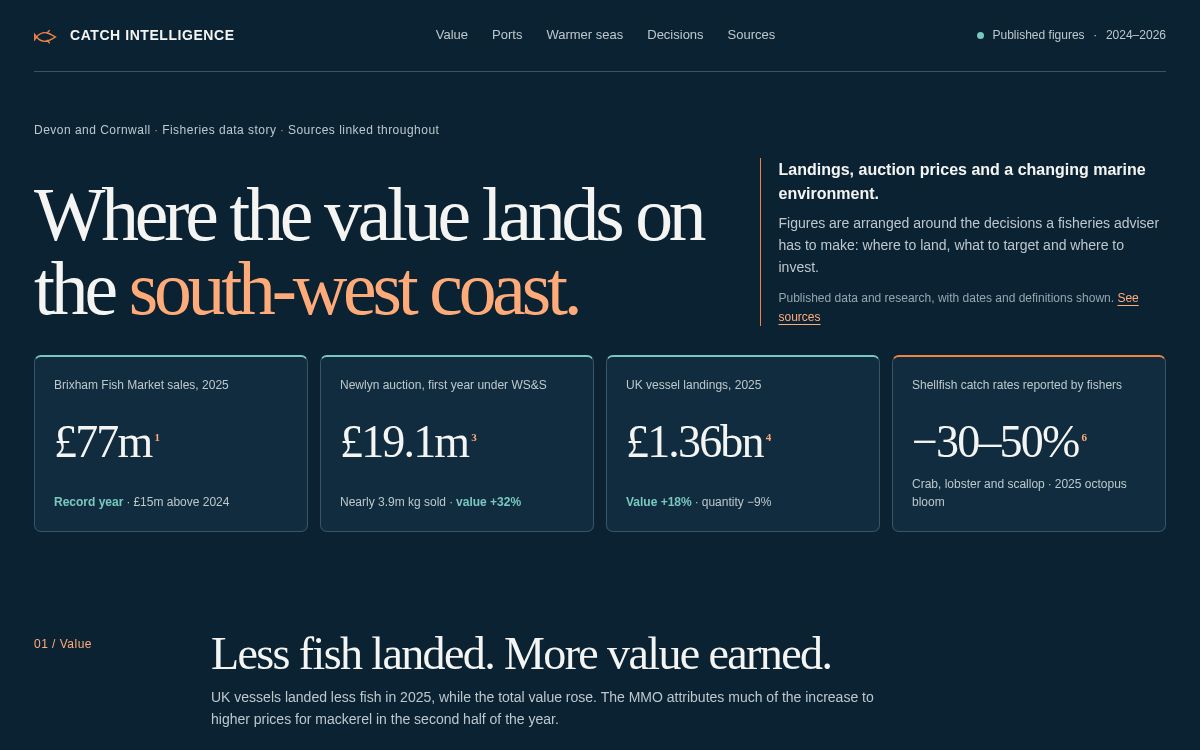
Fisheries information is spread across annual statistics, harbour updates and environmental research. This dashboard concept brings several of those signals into one readable view for Devon and Cornwall, with source links beside the figures.
Catch Intelligence is a self-initiated Higher Ground concept. It is not an official reporting service, a live data feed or a client project. The figures in this article and prototype come from published sources, and each measure keeps its own date and definition.
Explore the Catch Intelligence dashboard · See the port view · Read the environmental context
Why compare weight and value?
The Marine Management Organisation’s 2025 UK Sea Fisheries Statistics report says UK vessels landed 675,000 tonnes of sea fish, 9% less than in 2024. The value rose 18% to £1.36 billion. The MMO links much of that increase to higher mackerel prices in the second half of 2025.
Showing those measures side by side makes the difference easier to see: lower landed volume does not automatically mean lower value. The prototype keeps the national totals separate from individual port market sales, which measure different things.
Three ports, three different stories
At Brixham, Torbay Council reports £77 million of fish market sales in 2025, £15 million above 2024. The market is operating at full capacity, and the council describes proposals for 2,900 square metres of additional waterside space across five units. Those are plans, not delivered capacity.
At Newlyn, the harbour commissioners reported that the first year of the W. Stevenson & Sons auction concession handled nearly 3.9 million kilograms of fish worth £19.1 million. Volume was up 22% and value up 32% year on year. The figures cover that first year of operations, rather than a calendar year.
Plymouth’s story is currently a feasibility question. The council backed a study exploring options to reopen a fish market. The prototype labels that as a study, not an approved reopening.
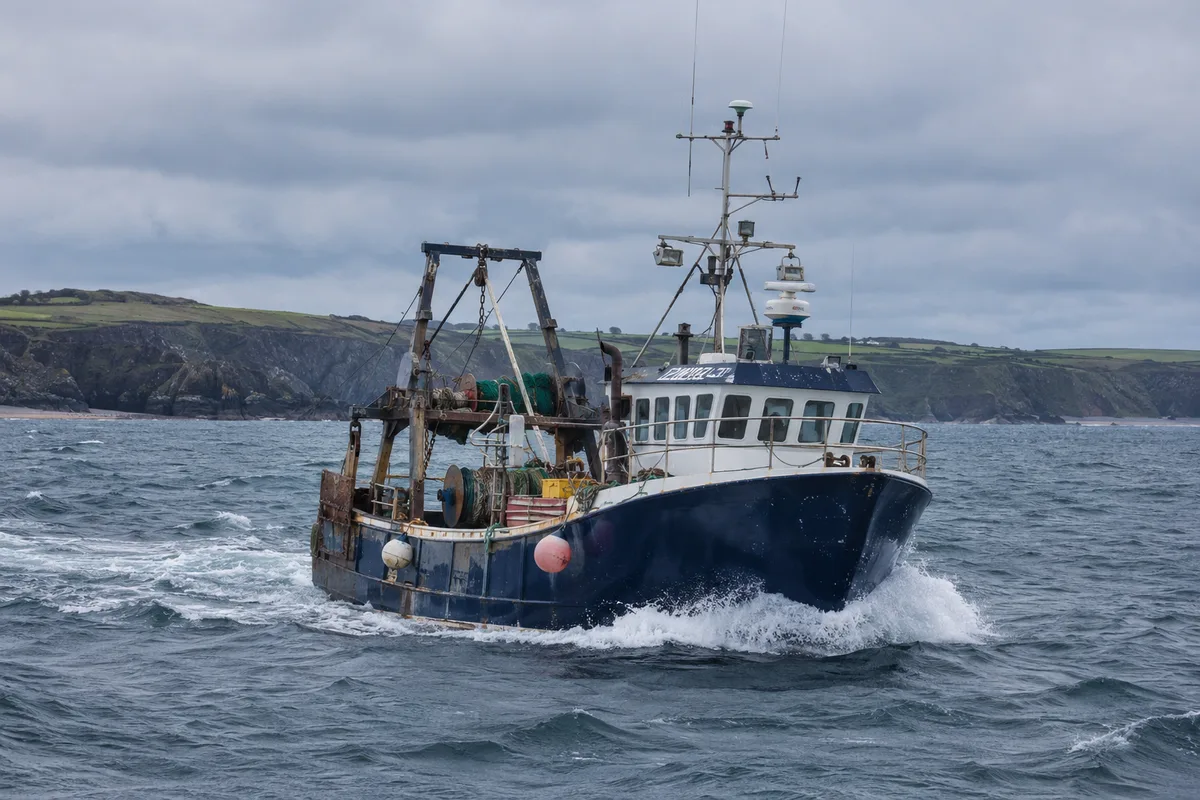
Show environmental change with context
The Marine Biological Association’s 2025 octopus report describes the largest common octopus bloom in at least 75 years. Its survey of 40 fishers found more than half reporting negative impacts; surveyed fishers reported shellfish catch rates 30% to 50% lower during 2025.
A separate Devon and Severn IFCA analysis looked at landings from 18 South Devon potting vessels. Compared with 2023, crab landings were lower for 16 vessels and lobster landings were lower for 15. These are separate datasets, and the figures alone do not establish that the octopus bloom caused every change.
The dashboard puts the environmental research beside the landing figures, with its limits visible. The research discusses warmer seas and shifting currents as possible contributing conditions; those factors are still being studied.
Design around decisions, and make the limits clear
A useful fisheries dashboard should help people move from a headline to a question: how are quantity and value changing, what is happening at each port, and where might market capacity or environmental change need closer attention?
The prototype uses a dark blue canvas, compact data cards and simple charts to make those relationships easier to scan. Separate port cards highlight Brixham, Newlyn and Plymouth. Source links, time periods and notes sit beside the figures, so readers can check what is being compared.
Some questions, such as comparing weekly auction prices by species, would need more detailed operational data than the public sources used here. The page presents them as directions for a fuller service, rather than pretending the current figures answer them.
A starting point for better reporting
This concept is a way to explore how complex marine and environmental information could be presented. Developing it into an operational tool would mean working with fisheries analysts, scientists, port teams and enforcement users to confirm the data, definitions and decisions that matter, then testing the interface against real tasks.
That is the kind of work Higher Ground does: making complex digital services and data easier to understand and use. Talk to us about a dashboard or reporting challenge.
Sources
- Marine Management Organisation: UK Sea Fisheries Statistics 2025
- Marine Management Organisation: 2024 comparison figures
- Torbay Council: Brixham harbour growth and market proposals
- Brixham Fish Market: market information
- Newlyn Pier & Harbour Commissioners: May 2025 update
- Marine Biological Association: common octopus bloom report
- Devon & Severn IFCA: January 2026 octopus update
- Plymouth City Council: fish market feasibility study