.svg)

How to improve conversion rate optimisation?
Enhance your website's conversion rate with our comprehensive CRO strategy guide. Discover 9 key steps and useful tasks for guaranteed success.


To most businesses a website is a meeting place to carry out transactions with potential new customers.
Increasingly, we now refer to:
(A) turning customers into clients (acquisition) and
(B) applying for, or selling something, as a ‘conversion’.
The success of a conversion rate optimisation (CRO) strategy depends on how well you define, track and analyse your micro and macro conversions. Increasing conversion rates helps all website owners to improve trade, achieve more sales and develop a solid and successful business strategy.
Micro conversions are the smaller steps users take on your website that paves the way for a macro conversion.
Eg. email clicks, blog subscription, quiz participation, newsletter signup, video play, pricing page visit, etc. These micro conversions can get your prospective customer one step closer to sign up or purchase (macro conversion).
When a user takes an action that meets the main goals of your website, we call it a macro conversion (also known as primary conversion). Eg. If you run a SaaS company, then a product purchase or free trial signup can be a macro conversion for you.
In this blog you will find 9 key steps and useful tasks to ensure your website will be a CRO success.
“Ensure your website generates the maximum return on your investment.” Rob Hufton
Establish what is important
CRO initial review
- Is your traffic of any value? What are you doing with it?
- What type of lead or conversion do you want to improve?
- Are visitors going to the right areas,,or leaving at key points?
CRO analytics gives you the exact picture of how visitors behave on your site; otherwise, you would just be making assumptions. The analytical method for optimising conversion rates is also known as ‘quantitative data analysis’. This analysis gives you numbers about customers’ behaviour.
There are many ways to gather data to gain insights. Google Analytics is usually the first place to look, but other tools can also provide detailed pictures. However it depends entirely on what you want to analyse. SEO keywords are easier to analyse using auditing tools such as Ahrefs, or Google Search Central (formerly Webmaster Tools).
Quantitative data analysis helps CRO experts formulate a picture of what is really happening, then gather focused insights to inform the correct steps needed towards increasing conversion rates.
Key metrics tracked and analysed by CRO experts often include the following:
- The source of your website visitors
- What website features they engage with
- Where they spend most of their time
- What devices and browsers they use
- Where visitors found a link to your site
- Who your customers are (their persona)
- Why visitors abandoned your website
QUESTION:
What are the top 5 really useful data feeds most often used by CRO experts?
When we asked Rob Hufton, resident UX and CRO expert at Higher Ground, he listed:
1. Pages most viewed (exit rate and time on page)
2. Lead sources, where they originate from (social, paid, organic)
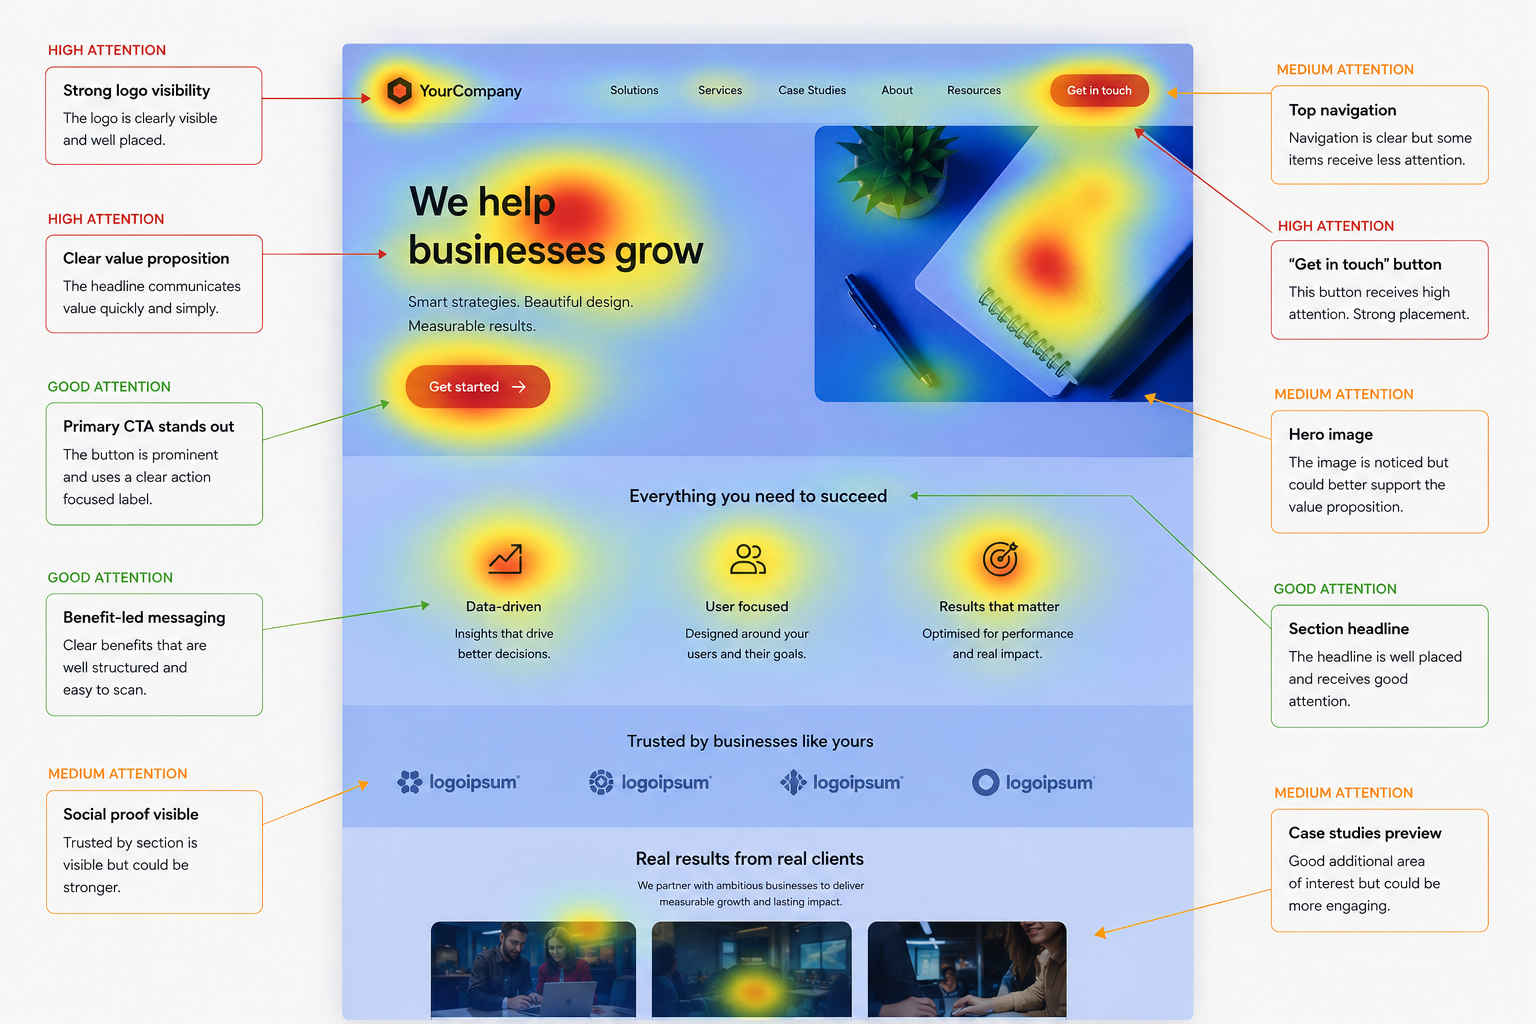
3. Heatmaps and click tracking data
4. Lead types, quality, demographic and value
5. If you are starting from scratch, what you can learn from anything that does work well
CRO analytic tools help you to gather insights and data to look into every aspect of your website’s performance generally in the following report formats:
- REAL-TIME REPORTS
Real-time reports keep track of your active users, the users’ locations, the traffic, content, and the top lead generating activities like adverts, clicks and videos. Also, the reports show you the conversions you have achieved in real-time.
- AUDIENCE REPORTS
The audience reports display essential insights about your audience. It is not in real-time but does give you snapshots of the audience. With this function you can view the demographics, geographical location, devices and source of the users.
- ACQUISITION REPORTS
The acquisition reports give you valuable insights about the users’ pathway to your website. Here you can view the critical information about how your users landed at your website and know the total number of visits to your sites.
- CONVERSIONS
Conversion reports show you conversion goals, e-commerce reports, and multi-channel funnels. Ecommerce reports are probably the most effective tool of this package, where you can view the most popular products and their revenue; diving deeper into the analytics to understand how users are behaving and the reasons for drop-offs and abandoned carts.
QUESTION:
What are the current top 10 most popular web analytics tools?
- Google Analytics Turning data insights into action
- Similarweb Measuring the digital world
- Clicky Analyse website traffic in real-time
- Matomo Website analysis with 100% control
- Finteza Advanced web analysis & evaluation
- Woopra Understanding the customer journey
- Chartbeat Measuring customer engagement
- Hotjar Understanding site traffic & data
- Crazyegg Detailed analysis of websites
- Mixpanel Web analysis and data science
Web data analytics reports give you a panoramic view of customers’ behaviour, and are essential tools to analyse data and optimise business performance and growth.
TASK 1:
Using one of the data analysis tools mentioned above, find which page of your website has the most views, and which page has the lowest viewing figures. Give 3 explanations for each.